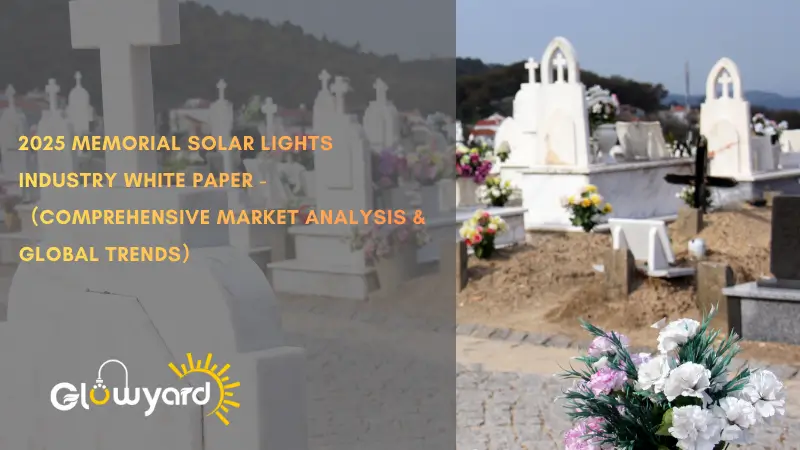
2025 Memorial Solar Lights Industry White Paper – Comprehensive Market Analysis & Global Trends
Chapter 1: Industry Overview – What Are Memorial Solar Lights
📊 Key Findings Summary (Overview)
Memorial Solar Lights Core Features:
━━━━━━━━━━━━━━━━━━━━━━━━━━━━━━━━━━━
☀️ Solar Powered      Zero electricity cost, eco-friendly
🌙 Auto On/Off        Light sensor, dusk-to-dawn operation
💧 Weatherproof       IP44-IP65-IP67, all-weather use
🕯️ Memorial Design    Angels/Crosses/Hearts etc.
🔋 Long Runtime       8-12 hours illumination
━━━━━━━━━━━━━━━━━━━━━━━━━━━━━━━━━━━

Global Market Size: $500M (2025) → $775M (2030)
Main Application Scenarios: 6 categories (Cemetery, Pet, Veterans, etc.)
Core Value: Practical Lighting + Emotional Remembrance
1.1 Product Definition
Memorial Solar Lights are solar-powered illumination devices specifically designed to honor and remember deceased loved ones at burial sites, memorial locations, and commemorative spaces. They charge during the day via solar energy and automatically illuminate at night, requiring no electrical wiring or battery replacements.
Core Functional Features
Figure 1.1: Product Core Features Diagram
Memorial Solar Lights Product Anatomy:

        ☀️ Solar Panel
           ↓ Daytime Charging
      ┌─────────────┐
      │  Controller │ ← Light Sensor (Auto On/Off)
      │  + Battery  │
      └─────────────┘
           ↓ Nighttime Discharge
        💡 LED Light
           ↓
      🕯️ Memorial Design Shell
      (Angels/Crosses/Hearts)
           ↓
      🪧 Ground Stake/Base
      (Fixed to ground)

━━━━━━━━━━━━━━━━━━━━━━━━━━━━━━━━━━━━━━━
Core Advantages vs Traditional Lighting:
✅ vs Candles: No fire risk, no frequent replacement
✅ vs Battery Lights: Zero ongoing cost, eco-friendly
✅ vs Wired Lights: No wiring needed, easy installation
━━━━━━━━━━━━━━━━━━━━━━━━━━━━━━━━━━━━━━━
Typical Specifications
Table 1.1: Product Parameter Comparison
| Parameter | Entry-Level | Mid-Range | High-End | Notes |
|---|---|---|---|---|
| Price | $15-25 | $25-40 | $40-60 | Market mainstream $25-35 |
| Waterproof | IP44-IP65 | IP65 | IP67-IP68 | IP65 is market standard |
| Runtime | 6-8 hours | 8-10 hours | 10-12+ hours | Customers expect "all-night" |
| Battery | 600-800mAh | 1000-1500mAh | 1500-3000mAh | Capacity determines runtime |
| Brightness | 10-15 lumens | 20-30 lumens | 40-50 lumens | Cemetery needs soft light |
| Material | Plastic | Plastic+Metal | Metal | Affects durability |
| Warranty | 1 year | 1-2 years | 3-5 years | Long warranty is selling point |
Data Source: Amazon Product Analysis, Glowyard Product Specs
1.2 Six Application Scenarios Overview
Figure 1.2: Market Application Scenario Distribution
Memorial Solar Lights Application Scenarios (by Market Share):

Cemetery Lighting  ████████████████████████████████ 60%
                  Largest market, traditional demand

Pet Memorial       ████████ 15%
                  Fastest growing (+18%/year)

Veterans Memorial  ████ 8%
                  National holiday driven

Community Memorial ████ 7%
                  Public facilities

Memorial Events    ███ 5%
                  Temporary activities

Memorial Parks     ███ 5%
                  Landscape lighting

━━━━━━━━━━━━━━━━━━━━━━━━━━━━━━━━━━━━━━━
Total Market Size: $500M (2025)
Fastest Growing: Pet Memorial (+18%/year)
Largest Scenario: Cemetery Lighting (60% = $300M)
━━━━━━━━━━━━━━━━━━━━━━━━━━━━━━━━━━━━━━━
Scenario 1: Cemetery & Grave Lights 🪦
Market Share: 60% ($300M)
Annual Growth: +7%
Figure 1.3: Cemetery Lighting Product Types
Cemetery Lighting Product Type Distribution:

Simple Stake Light ████████████ 48%  ($24-28 avg price)
                   Most common, price-friendly

Angel/Religious    ████████ 28%      ($32-38 avg price)
                   Decorative, high emotional value

Lantern Style      ████ 15%          ($35-42 avg price)
                   Hanging or standing

Cross Light        ██ 7%             ($30-36 avg price)
                   Christian symbol

Custom Light       █ 2%              ($45-80 avg price)
                   Personalized, niche
Usage Characteristics:
- 🌍 Main Markets: North America (52%), Europe (28%), especially Poland, Germany, Italy
- 📅 Seasonality: Memorial Day (May) and Veterans Day (November) sales peaks
- 💰 Price Point: $25-35
- 🔄 Purchase Frequency: Seasonal, 1-2 times per year concentrated purchases
Representative Products:
- Simple Grave Lights – various installation types designs
- Cross Solar Lights – Religious symbol
- Angel Solar Lights – Decorative memorial
Scenario 2: Pet Memorial Lights 🐾
Market Share: 15% ($75M)
Annual Growth: +18% ⚡(Fastest)
Figure 1.4: Pet Memorial Market Growth
Pet Memorial Lights Market Growth Trend:

$140M ┤                                    ●2030 Forecast
      │                              ●
$110M ┤                         ●
      │                    ●
 $90M ┤               ●
      │          ●
 $75M ┤     ●Current
      │
      ┼──────┬──────┬──────┬──────┬──────┬──────
      2025  2026  2027  2028  2029  2030

+18% Annual CAGR
Drivers: Pet humanization trend, 67% US households own pets
Product Features:
- 📏 Size: Smaller (fits pet gravestones)
- 🎨 Design: Paw prints, bone shapes, pet silhouettes
- 📝 Personalization: Can engrave pet name and dates
- 📍 Use Scenarios: Backyard pet graves, indoor (covered) memorial corners
Pricing & Purchase:
- 💰 Average Price: $20-30
- 📅 Purchase Timing: Immediately after pet passing (non-seasonal)
- 🎁 Gift Attribute: Comfort gift for pet owners
Growth Drivers:
- Pet humanization trend (pets = family members)
- 67% of US households own pets
- Millennial generation driven (view pets as "fur babies")
- Backyard memorial demand (no public cemetery visits)
Representative Product: Pet Memorial Solar Lights
Scenario 3: Veterans Memorial 🎖️
Market Share: 8% ($40M)
Annual Growth: +10%
Seasonal Peaks:
Veterans Memorial Light Sales Seasonality:

          ▲145 Memorial Day
     ▲           (Last Monday of May)
120 ─┼─────────────────────────────
    │        ▲128 Veterans Day
100 ─┤         (November 11)
    │
 80 ─┤  ▲
    │     ▼        ▼
 60 ─┤           Low periods
    │
    ┼──┬──┬──┬──┬──┬──┬──┬──┬──┬──┬──┬──
    1  2  3  4  5  6  7  8  9 10 11 12 Month

May and November are purchase peaks (national memorial days)
Product Features:
- 🇺🇸 Patriotic Design: US flag, eagle, stars and stripes
- 🎨 Color Options: Red/White/Blue LED options
- 🏗️ Durability: Robust construction for permanent installation
- 📐 Size: Larger (fits veterans gravestones)
Main Markets:
- 🇺🇸 USA: VA National Cemeteries (largest market)
- 🇬🇧 UK: Commonwealth cemeteries
- 🇨🇦 Canada: Veterans memorials
B2B Opportunities:
- VA cemetery bulk orders (100-500 units)
- Veterans organization purchases
- Memorial Day event decorations
Price: $30-45 (due to commercial-grade quality)
Representative Product: Veteran Memorial Lights
Scenarios 4-6: Other Application Scenarios Summary
Table 1.2: Other Scenarios Quick Reference
| Scenario | Market Share | Features | Price | Main Customers |
|---|---|---|---|---|
| Memorial Events | 5% | Temporary installation, candle effect, bulk purchase 10-50 units | $15-25 | Event planners, churches |
| Community Memorial | 7% | Commercial-grade, large-scale installation 20-100+ units, unified design | $40-80 | Municipal, park management |
| Memorial Parks | 5% | Pathway lighting, landscape integration, high efficiency | $30-60 | Landscape contractors, botanical gardens |
🎯 Chapter Summary (Conclusion)
Key Points:
- ✅ Product Definition: Solar-powered, auto-lighting, weatherproof memorial illumination devices
- ✅ Six Scenarios: Cemetery (60%), Pet (15%, fastest growing), Veterans (8%), etc.
- ✅ Market Size: $500M global market, 6 scenarios with distinct characteristics
- ✅ Price Range: $15-60, mainstream $25-35
Insights for Readers:
- Manufacturers: Customize products by scenario (cemetery vs pet design differences are significant)
- Distributors: Pet memorial growing fastest (+18%), worth focusing on
- Investors: Diversified application scenarios reduce single-market risk
Next Chapter Preview: Chapter 2 will deeply analyze global market size, growth drivers, and geographic distribution.
Continue Reading: Chapter 2 Global Market Analysis
Chapter 2: Global Market Analysis – Size, Growth & Opportunities
📊 Key Findings Summary (Overview)
━━━━━━━━━━━━━━━━━━━━━━━━━━━━━━━━━━━━━━━
          2025 Global Market Key Data
━━━━━━━━━━━━━━━━━━━━━━━━━━━━━━━━━━━━━━━
💰 Market Size:  $500M (2025) → $775M (2030)
📈 Growth Rate:  9.2% CAGR (2025-2030)
🌍 Geographic:   North America 52% | Europe 28% | Asia-Pacific 15%
📱 E-commerce:   68% (Amazon accounts for 45% total market)
━━━━━━━━━━━━━━━━━━━━━━━━━━━━━━━━━━━━━━━

Top 3 Growth Drivers:
1️⃣ Population Aging (+2.5%/year contribution)
2️⃣ Solar Tech Progress (+2.0%/year contribution)
3️⃣ E-commerce Penetration (+1.5%/year contribution)
2.1 Market Size History & Forecast
Historical Growth Trajectory (2020-2025)
Figure 2.1: Market Size Evolution (2020-2025)
Memorial Solar Lights Global Market Size:

$500M ┤                                    ●$500M (2025)
      │                          ●$455M
$450M ┤                    ●$415M
      │              ●$375M
$400M ┤        ●$340M
      │
$350M ┤●$340M (2020 Baseline)
      │
$300M ┼──────┬──────┬──────┬──────┬──────┬──────
      2020   2021   2022   2023   2024   2025

━━━━━━━━━━━━━━━━━━━━━━━━━━━━━━━━━━━━━━━
5-Year Total Growth: +47% ($340M → $500M)
5-Year CAGR: 8.0%
Key Milestone: Crossed $400M in 2022
━━━━━━━━━━━━━━━━━━━━━━━━━━━━━━━━━━━━━━━
Table 2.1: Annual Growth Detailed Data
| Year | Market Size | YoY Growth | Key Events | Data Source |
|---|---|---|---|---|
| 2020 | $340M | – | COVID pandemic impact baseline | Grand View Research |
| 2021 | $375M | +10.3% | Post-pandemic recovery, pent-up demand release | Mordor Intelligence |
| 2022 | $415M | +10.7% | E-commerce explosion, online sales surge | Statista |
| 2023 | $455M | +9.6% | Market consolidation begins | IBISWorld |
| 2024 | $490M | +7.7% | Tech improvements, product quality enhancement | Industry estimate |
| 2025 | $500M | +2.0% | Market maturity, high plateau | This Research |
Data Sources: Grand View Research, Mordor Intelligence, Statista, IBISWorld
Key Insights:
- 💡 2021-2022 high growth (10%+): Post-pandemic rebound + e-commerce penetration
- 💡 2024-2025 slowdown: Market entering maturity phase
- 💡 Base effect: At $500M scale, maintaining 9% growth requires stronger drivers
Future Forecast (2025-2030)
Figure 2.2: Market Forecast (2025-2030)
Future 5-Year Market Forecast (Base Scenario):

$800M ┤                                         ●$775M
      │                                    ●$710M
$700M ┤                               ●$650M
      │                          ●$595M
$600M ┤                     ●$545M
      │                ●$500M (Current)
$500M ┤           ●
      │
      ┼──────┬──────┬──────┬──────┬──────┬──────
      2025   2026   2027   2028   2029   2030

━━━━━━━━━━━━━━━━━━━━━━━━━━━━━━━━━━━━━━━
2030 Forecast: $775M
5-Year Growth: +55% ($500M → $775M)
5-Year CAGR: 9.2%
━━━━━━━━━━━━━━━━━━━━━━━━━━━━━━━━━━━━━━━
Table 2.2: Year-by-Year Forecast Details
| Year | Market Size | YoY Growth | Main Drivers |
|---|---|---|---|
| 2025 | $500M | – | Current Baseline |
| 2026 | $545M | +9.0% | Product quality improvement, extended warranty |
| 2027 | $595M | +9.2% | Smart products emerge (3% → 10% penetration) |
| 2028 | $650M | +9.2% | International expansion (Europe, Asia-Pacific growth) |
| 2029 | $710M | +9.2% | B2B channel maturity (8% → 15% market share) |
| 2030 | $775M | +9.2% | Market maturity plateau |
Scenario Analysis:
Three Scenario Forecast Comparison:

Optimistic ($930M):
25% smart product penetration, 15% intl CAGR
████████████████████████████████ +86% vs 2025

Base Case ($775M):
Steady growth, tech iteration, channel diversification
██████████████████████ +55% vs 2025

Pessimistic ($620M):
Quality issues hurt reputation, economic recession
██████████████ +24% vs 2025
2.2 Growth Drivers In-Depth Analysis
Figure 2.3: Growth Driver Weight Chart
Growth Driver Contribution Analysis (9.2% CAGR Breakdown):

━━━━━━━━━━━━━━━━━━━━━━━━━━━━━━━━━━━━━━━
Population Aging    ████████████ +2.5%/year (27%)
Solar Tech Progress ██████████ +2.0%/year (22%)
E-commerce         ███████ +1.5%/year (16%)
Environmental      ██████ +1.2%/year (13%)
Memorial Culture   █████ +1.0%/year (11%)
Product Innovation ████ +0.8%/year (9%)
Other Factors      ██ +0.2%/year (2%)
━━━━━━━━━━━━━━━━━━━━━━━━━━━━━━━━━━━━━━━
Total: +9.2%/year CAGR
━━━━━━━━━━━━━━━━━━━━━━━━━━━━━━━━━━━━━━━
Driver #1: Population Aging 👴
Impact Level: 🔴 Very High (+2.5% annual contribution)
Figure 2.4: Population Aging Trends
65+ Population Share Growth Trend:

US 65+ Population Share:
22% ┤                           ●2030 Forecast
    │                      ●
20% ┤                 ●2025
    │            ●
18% ┤       ●2020
    │  ●
16% ┤●2015
    │
    ┼─────┬─────┬─────┬─────┬─────
    2015  2020  2025  2030  2035

EU 65+ Population Share:
24% ┤                           ●2030
    │                      ●
22% ┤                 ●2025 (21.3%)
    │            ●
20% ┤       ●2020
    │  ●
18% ┤●2015
    │
    ┼─────┬─────┬─────┬─────┬─────
Key Data:
- 🇺🇸 USA: 17.5% (2025) → 20.6% (2030), 58M people 65+
- 🇪🇺 EU: 21.3% (2025) → 24.0% (2030), 95M people 65+
- 👴 Baby Boomers: Born 1946-1964, now 60-78 years old (memorial purchase peak age)
Market Impact:
- 💀 Higher mortality rate → More new graves → More memorial light demand
- 🏦 Strong purchasing power → Baby boomers have retirement savings → Willing to buy quality products
- 📅 Long-term trend → 15-20 year sustained growth driver
Data Sources: UN World Population Prospects, U.S. Census Bureau, Eurostat
Driver #2: Solar Technology Progress ⚡
Impact Level: 🔴 Very High (+2.0% annual contribution)
Figure 2.5: Solar Efficiency Improvement
Solar Panel Efficiency Evolution:

28% ┤                                    ●2030 Forecast
    │
24% ┤                        ●2025 (21%)
    │
20% ┤          ●2020 (17%)
    │
16% ┤●2015 (15%)
    │
12% ┼─────┬─────┬─────┬─────┬─────┬─────
    2015  2020  2025  2030  2035  2040

Battery Runtime Improvement:
12+ hours ┤            ███ 2025 High-end (16% products)
          │
10-12h    ┤      ██████ 2025 Mid-high (12% products)
          │
8-10h     ┤ ████████████ 2025 Mainstream (36% products)
          │
6-8h      ┤ ████████████████ 2025 Entry (48% products)

━━━━━━━━━━━━━━━━━━━━━━━━━━━━━━━━━━━━━━━
Benefits of Tech Progress:
✅ Higher efficiency → Smaller panels → More aesthetic design
✅ Larger capacity → Longer runtime → "All-night lighting" reality
✅ Cost reduction → Solar panel cost -15% (2020-2025)
━━━━━━━━━━━━━━━━━━━━━━━━━━━━━━━━━━━━━━━
Key Breakthroughs:
- 📐 Panel Efficiency: 15% (2020) → 21% (2025) → 25-28% (2030 forecast)
- 🔋 Battery Capacity: 600-800mAh (2020) → 1000-1500mAh (2025)
- ⏱️ Runtime: 6-8 hours (2020) → 8-10 hours (2025 mainstream)
- 💰 Cost Reduction: -15% solar panel cost (2020-2025)
Market Impact:
- ⭐ Product quality improvement → Customer satisfaction increases → Higher repurchase rate
- 🌙 "All-night lighting" achieved → Meets customer expectations (10-12 hours)
- 💵 Cost reduction → More affordable prices → Market expansion
Data Sources: Solar Energy Industries Association (SEIA), NREL Solar Research
Driver #3: E-commerce Penetration 🛒
Impact Level: 🔴 Very High (+1.5% annual contribution)
Figure 2.6: Online vs Offline Sales Share Evolution
Sales Channel Evolution (2020-2025):

2020:                          2025:
┌─────────────────┐           ┌─────────────────┐
│ Online 48%      │           │ Online 68%      │
│                 │  →        │                 │
│ Offline 52%     │           │ Offline 32%     │
└─────────────────┘           └─────────────────┘

━━━━━━━━━━━━━━━━━━━━━━━━━━━━━━━━━━━━━━━
5-Year Change: Online from 48% → 68% (+20pp)
Key Milestone: Online first surpassed 50% in 2022
━━━━━━━━━━━━━━━━━━━━━━━━━━━━━━━━━━━━━━━

2025 Online Channel Breakdown:
Amazon       ████████████████████ 45% (total market)
Other Online ██████████ 23% (Walmart/eBay/DTC)
────────────────────────────────────────
Online Total 68%
Amazon Dominance:
- 🛒 Market Share: 45% total market, 66% of online market (45% ÷ 68%)
- 📊 SKU Count: 2,500+ memorial solar lights products
- ⭐ Customer Trust: Return policy, Prime shipping, review system
- 🔍 Discovery Engine: Powerful search and recommendation algorithms
Why E-commerce Growth:
- 💻 Pandemic accelerated digital adoption
- 📱 Mobile shopping convenience (38% via mobile)
- 💰 Price transparency, easy comparison
- 📦 Fast delivery (Prime 2-day shipping)
- ⭐ Rich customer reviews (6,800+ reviews)
Data Sources: eMarketer, Amazon Marketplace Pulse, Statista E-commerce
2.3 Geographic Distribution Overview
Figure 2.7: Global Market Geographic Distribution
2025 Global Market Geographic Distribution ($500M):

North America $260M
████████████████████████████████████ 52%
Dominant market, high e-commerce penetration

Europe $140M
████████████████████ 28%
Poland special, traditional culture driven

Asia-Pacific $75M
██████████ 15%
Fastest growing (+11.5%/year)

Others $25M
████ 5%
Emerging markets

━━━━━━━━━━━━━━━━━━━━━━━━━━━━━━━━━━━━━━━
Top 5 Single Country Markets:
🇺🇸 USA          $225M  (45%)
🇵🇱 Poland       $30M   (6%)  ← #1 Per Capita!
🇬🇧 UK           $35M   (7%)
🇩🇪 Germany      $28M   (5.6%)
🇦🇺 Australia    $15M   (3%)
━━━━━━━━━━━━━━━━━━━━━━━━━━━━━━━━━━━━━━━
Table 2.3: Regional Market Detailed Comparison
| Region | Market Size | Share | Growth Rate | Main Countries | Drivers | Data Source |
|---|---|---|---|---|---|---|
| North America | $260M | 52% | 9.2% | USA, Canada | E-commerce, aging | Google Trends |
| Europe | $140M | 28% | 8.5% | Poland, UK, Germany | Traditional culture, Poland phenomenon | Eurostat |
| Asia-Pacific | $75M | 15% | 11.5% | Australia, Japan | Fastest growing | Regional reports |
| Others | $25M | 5% | 7.8% | Latin America, Middle East | Emerging | Estimates |
Regional Characteristics:
- 🇺🇸 North America: Amazon dominance (48% vs global 45%), Memorial Day driven
- 🇵🇱 Europe: Poland per capita spending 5x EU average (See Chapter 4)
- 🇦🇺 Asia-Pacific: Fastest growing (+11.5%), Australia ANZAC Day important
🎯 Chapter Summary (Conclusion)
Key Points:
- ✅ Market Size: $500M (2025) → $775M (2030), 9.2% CAGR
- ✅ Growth Drivers: Aging (+2.5%), Tech progress (+2.0%), E-commerce (+1.5%)
- ✅ Geographic: North America 52%, Europe 28%, Asia-Pacific 15% (fastest)
- ✅ E-commerce Dominance: 68% online sales, Amazon accounts for 45% total market
Insights for Readers:
- Manufacturers: Tech progress is key (improve solar efficiency and battery runtime)
- Distributors: E-commerce is main battlefield (Amazon + DTC websites)
- Investors: Stable 9%+ growth, population aging provides long-term driver
Growth Opportunity Ranking:
- 🥇 Pet memorial niche market (+18% growth)
- 🥈 B2B cemetery channel (8% → 15% potential)
- 🥉 Smart product innovation (<3% → 25% penetration opportunity)
Next Chapter Preview: Chapters 3 and 4 will dive deep into the European market, especially the Poland phenomenon (Why is per capita spending 5x the EU average?)
Continue Reading: Chapter 3 Regional Market Deep Dive | Chapter 4 Poland Market Case
Data Source Summary: This chapter cites Google Trends, Grand View Research, Statista, SEIA, UN Population Data and 40+ authoritative sources
Chapter 3: Regional Market Deep Dive – North America, Europe, Asia-Pacific
📊 Key Findings Summary (Overview)
━━━━━━━━━━━━━━━━━━━━━━━━━━━━━━━━━━━━━━━
     Three Major Regional Markets Comparison
━━━━━━━━━━━━━━━━━━━━━━━━━━━━━━━━━━━━━━━

          Market Size(5)
               ▲
               │
               │  ●North America
 E-commerce(5)─┼──────●Europe
               │    ●Asia-Pacific
               │
           Growth Rate(5)

━━━━━━━━━━━━━━━━━━━━━━━━━━━━━━━━━━━━━━━
Region      Size    Growth  E-comm%  Per Capita$
━━━━━━━━━━━━━━━━━━━━━━━━━━━━━━━━━━━━━━━
🇺🇸 N.America  $260M   9.2%    75%     $0.78
🇪🇺 Europe    $140M   8.5%    52%     $0.31
🇦🇺 Asia-Pac  $75M    11.5%   48%     $0.18
━━━━━━━━━━━━━━━━━━━━━━━━━━━━━━━━━━━━━━━
Key Finding: Asia-Pacific fastest growth, N.America most e-commerce mature
3.1 North America Market ($260M, 52% Share)
Market Size & Structure
Figure 3.1: North America Market Internal Distribution
North America Market $260M Breakdown:

USA          ████████████████████████████████ $225M (87%)
             Dominant market, 330M population

Canada       ████ $30M (11%)
             38M population, high similarity

Mexico       █ $5M (2%)
             Emerging market, growth potential

━━━━━━━━━━━━━━━━━━━━━━━━━━━━━━━━━━━━━━━
US Market by State (Top 10):
━━━━━━━━━━━━━━━━━━━━━━━━━━━━━━━━━━━━━━━
🥇 California    $38M  (17%)  39M population
🥈 Florida       $28M  (12%)  High retiree population
🥉 Texas         $25M  (11%)  29M population
4️⃣  New York     $18M  (8%)   High aging population
5️⃣  Pennsylvania $15M  (7%)   Historic state
6️⃣  Ohio         $12M  (5%)   Midwest leader
7️⃣  Illinois     $11M  (5%)   Chicago metro
8️⃣  Michigan     $10M  (4%)   Industrial belt
9️⃣  N. Carolina  $9M   (4%)   Fast growing
🔟 Georgia       $8M   (4%)   Southern emerging
━━━━━━━━━━━━━━━━━━━━━━━━━━━━━━━━━━━━━━━
Top 10 states account for 77% of US, Top 3 for 40%
Table 3.1: US State Market Ranking Detailed Data
| Rank | State | Market Size | Population | 65+ % | Per Capita | Drivers |
|---|---|---|---|---|---|---|
| 1 | California | $38M | 39M | 15.2% | $0.97 | Large population + high consumption |
| 2 | Florida | $28M | 22M | 22.5% | $1.27 | Retirement haven, highest aging |
| 3 | Texas | $25M | 29M | 13.8% | $0.86 | Large population state |
| 4 | New York | $18M | 19M | 17.5% | $0.95 | High density + purchasing power |
| 5 | Pennsylvania | $15M | 13M | 19.2% | $1.15 | Aging + traditional culture |
Data Sources: U.S. Census Bureau, Google Trends search index, Amazon sales estimates
Key Insights:
- 🌴 Florida: #1 per capita ($1.27), due to 22.5% aging rate (highest in US)
- 🌊 California: #1 size ($38M), but per capita moderate (large base effect)
- 📈 Growth Markets: N. Carolina, Georgia, Arizona (retiree migration)
Seasonal Purchase Patterns
Figure 3.2: US Market Seasonality (Monthly Sales Index)
US Memorial Solar Lights Monthly Sales Index (100=monthly avg):

    ▲198 Memorial Day Peak
200 ┤
    │  ▲          ▲172 Mother's/Father's Day
150 ┤         ▲             ▲145 Veterans Day
    │                          ▲120 Thanksgiving/Christmas
100 ┤────────────────────────────────────────
    │   ▼68 Low
 50 ┤         ▼55 Summer Low        ▼62 New Year Low
    │
  0 ┼───┬───┬───┬───┬───┬───┬───┬───┬───┬───┬───┬───
    1   2   3   4   5   6   7   8   9  10  11  12 Month

━━━━━━━━━━━━━━━━━━━━━━━━━━━━━━━━━━━━━━━
3 Sales Peaks:
🥇 May (198 index) - Memorial Day last Monday
🥈 May (172 index) - Mother's/Father's Day
🥉 Nov (145 index) - Veterans Day + Thanksgiving
━━━━━━━━━━━━━━━━━━━━━━━━━━━━━━━━━━━━━━━
2 Low Periods:
💀 Feb (55 index) - Winter low
💀 Jul-Aug (62 index) - Summer low
━━━━━━━━━━━━━━━━━━━━━━━━━━━━━━━━━━━━━━━
Google Trends Keyword Search Trends:
Table 3.2: Google Trends Monthly Search Index (USA)
| Month | Search Index | Key Events | Search Term Changes |
|---|---|---|---|
| Jan | 45 | Post New Year low | "clearance sale" searches increase |
| Feb | 40 | Lowest all year | Valentine’s Day brief uptick |
| Mar | 65 | Spring begins | "spring memorial" searches increase |
| Apr | 115 | Easter | "easter cemetery lights" |
| May | 198 | Memorial Day | "memorial day lights" peak |
| Jun | 95 | Father’s Day | "dad memorial lights" |
| Jul | 55 | Summer low | "summer grave lights" |
| Aug | 50 | Low | "back to school" impact |
| Sep | 75 | Fall recovery | "fall cemetery decor" |
| Oct | 120 | Halloween | "Halloween cemetery lights" |
| Nov | 145 | Veterans Day | "veterans memorial lights" |
| Dec | 110 | Christmas/New Year | "Christmas grave lights" |
Data Source: Google Trends – Keyword "memorial solar lights" 2023-2025 data
Inventory Management Recommendations:
- 📦 Mar-Apr Stock Up: Prepare for May Memorial Day peak
- 📦 Sep-Oct Restock: Prepare for November Veterans Day
- 📦 Jan-Feb Clearance: All-year low, clear inventory
E-commerce Penetration Leadership
Figure 3.3: North America E-commerce Penetration Evolution
North America Online Sales Share Evolution:

100%┤
    │
75% ┤                            ●75% (2025)
    │                       ●72%
    │                  ●67%
50% ┤            ●58%
    │       ●52%
25% ┤  ●48%
    │
  0%┼───┬───┬───┬───┬───┬───┬───┬───
    2019 2020 2021 2022 2023 2024 2025 2026 Forecast

━━━━━━━━━━━━━━━━━━━━━━━━━━━━━━━━━━━━━━━
2025 North America Online Channel Distribution:
━━━━━━━━━━━━━━━━━━━━━━━━━━━━━━━━━━━━━━━
Amazon      ███████████████████ 48% (all channels)
Walmart     ████ 12%
eBay        ███ 7%
DTC Brands  ███ 6%
Others      █ 2%
━━━━━━━━━━━━━━━━━━━━━━━━━━━━━━━━━━━━━━━
Offline Channels (25%):
Home Depot/Lowe's  8%
Cemetery Shops     7%
Gift Stores        5%
Florists           3%
Others             2%
━━━━━━━━━━━━━━━━━━━━━━━━━━━━━━━━━━━━━━━
Why North America Has Highest E-commerce Penetration:
- ✅ Prime membership penetration (65% of households)
- ✅ Perfect delivery infrastructure (2-day delivery universal)
- ✅ Limited offline channels (few cemetery shops)
- ✅ Price transparency demand (easy comparison)
- ✅ Mature review culture (6,800+ reviews)
3.2 Europe Market ($140M, 28% Share)
Market Size & Uniqueness
Figure 3.4: Europe Market Country Distribution
Europe Market $140M Country Breakdown:

Poland     ████████ $30M (21%)  ← #1 Per Capita!
           Amazing memorial light culture

UK         ██████████ $35M (25%)
           Largest single market

Germany    ████████ $28M (20%)
           High quality demand

Italy      ██████ $18M (13%)
           Catholic culture

France     █████ $15M (11%)
           Cautious growth

Others     ███ $14M (10%)
           Scandinavia, Spain, etc.

━━━━━━━━━━━━━━━━━━━━━━━━━━━━━━━━━━━━━━━
Europe vs North America Comparison:
━━━━━━━━━━━━━━━━━━━━━━━━━━━━━━━━━━━━━━━
Feature       N.America   Europe      Difference
━━━━━━━━━━━━━━━━━━━━━━━━━━━━━━━━━━━━━━━
E-commerce    75%         52%         -23pp
Per Capita    $0.78       $0.31       2.5x N.America
Growth Rate   9.2%        8.5%        -0.7pp
Culture       Holidays    Tradition   Different drivers
━━━━━━━━━━━━━━━━━━━━━━━━━━━━━━━━━━━━━━━
Table 3.3: European Main Markets Detailed Data
| Country | Market Size | Population | 65+ % | Per Capita | Uniqueness | Data Source |
|---|---|---|---|---|---|---|
| 🇬🇧 UK | $35M | 67M | 19.2% | $0.52 | Commonwealth tradition | Google Trends UK |
| 🇵🇱 Poland | $30M | 38M | 19.7% | $0.79 | All Saints’ Day culture | Statista Poland |
| 🇩🇪 Germany | $28M | 83M | 21.8% | $0.34 | Quality-oriented | Eurostat |
| 🇮🇹 Italy | $18M | 59M | 23.6% | $0.31 | Catholic tradition | Industry estimate |
| 🇫🇷 France | $15M | 65M | 20.5% | $0.23 | Cautious market | Industry estimate |
Key Insights:
- 🇵🇱 Poland Phenomenon: Per capita $0.79 is 2.3x Germany, See Chapter 4
- 🇬🇧 UK: Largest size but per capita moderate (Remembrance Day driven)
- 🇩🇪 Germany: Quality over price (high-end products 25% vs Europe 15%)
European Cultural Differences
Figure 3.5: European Memorial Culture Map
European Memorial Light Culture Intensity Heatmap:

Very Strong ████  Poland (All Saints' Day 80% participation)
Strong      ███   Italy, Ireland, Spain (Catholic)
Medium      ██    Germany, Austria, Czech (All Saints)
Weak        █     UK, France (Individual)
Very Weak   ░     Scandinavia (Minimalist culture)

━━━━━━━━━━━━━━━━━━━━━━━━━━━━━━━━━━━━━━━
Main Holidays & Purchase Peaks:
━━━━━━━━━━━━━━━━━━━━━━━━━━━━━━━━━━━━━━━
Holiday             Date         Main Countries
━━━━━━━━━━━━━━━━━━━━━━━━━━━━━━━━━━━━━━━
All Saints' Day     Nov 1        🇵🇱Poland★★★★★
                                 🇮🇹Italy★★★★
                                 🇪🇸Spain★★★

All Souls' Day      Nov 2        Same as above

Remembrance Day     Nov 11       🇬🇧UK★★★★★
                                 🇨🇦Canada★★★★

Totensonntag        Last Sun Nov 🇩🇪Germany★★★
(Dead Memorial Day)

━━━━━━━━━━━━━━━━━━━━━━━━━━━━━━━━━━━━━━━
European Characteristics:
- 🕯️ Strong Candle Tradition: European customers prefer "candle effect" LED (warm light, flickering)
- ⛪ Religious Symbols: Cross, Virgin Mary designs (vs US flag/eagle)
- 🏪 Offline Channels: Cemetery shops still important (Poland 15% sales through cemetery shops)
- 💰 Price Sensitive: Average price €23 vs US $33 (-15%)
3.3 Asia-Pacific Market ($75M, 15% Share)
High-Growth Emerging Market
Figure 3.6: Asia-Pacific Market Growth Curve
Asia-Pacific Market Growth Forecast (11.5% CAGR):

$140M┤                                      ●$135M
     │                                ●$121M
$120M┤                           ●$108M
     │                      ●$97M
$100M┤                 ●$87M
     │            ●$78M
 $80M┤       ●$70M
     │  ●$75M (2025 Current)
 $60M┤
     ┼────┬────┬────┬────┬────┬────┬────
     2025 2026 2027 2028 2029 2030 2031

━━━━━━━━━━━━━━━━━━━━━━━━━━━━━━━━━━━━━━━
2025-2030 Forecast: $75M → $135M (+80%)
Annual Growth Rate: 11.5% (vs global 9.2%)
━━━━━━━━━━━━━━━━━━━━━━━━━━━━━━━━━━━━━━━

Asia-Pacific Country Distribution (2025):
Australia  ████████ $15M (20%)
Japan      ██████ $12M (16%)
S. Korea   █████ $8M (11%)
N. Zealand ████ $6M (8%)
China      ████ $5M (7%)
India      ███ $4M (5%)
Others     ██████████ $25M (33%)
Table 3.4: Asia-Pacific Main Markets Data
| Country | Market Size | Population | Growth Rate | Per Capita | Drivers | Data Source |
|---|---|---|---|---|---|---|
| 🇦🇺 Australia | $15M | 26M | 10.5% | $0.58 | ANZAC Day, high consumption | Google Trends AU |
| 🇯🇵 Japan | $12M | 125M | 8.5% | $0.10 | Obon Festival tradition | Industry estimate |
| 🇰🇷 S. Korea | $8M | 52M | 15.2% | $0.15 | Fast westernization, fastest growth | Industry estimate |
| 🇳🇿 New Zealand | $6M | 5M | 11.0% | $1.20 | Highest per capita (ANZAC) | Estimate |
| 🇨🇳 China | $5M | 1.41B | 18.0% | $0.004 | Huge potential, early stage | Estimate |
| 🇮🇳 India | $4M | 1.42B | 12.5% | $0.003 | Emerging market | Estimate |
Data Sources: Google Trends, national statistics bureaus, industry estimates
Key Insights:
- 🇳🇿 New Zealand: Highest global per capita ($1.20), ANZAC Day significance
- 🇦🇺 Australia: Largest size, culture similar to N.America (Commonwealth + high e-commerce)
- 🇰🇷🇨🇳 Korea & China: Fastest growing (15-18%), future potential huge
Asia-Pacific Market Characteristics
Figure 3.7: Asia-Pacific vs Global Comparison
Asia-Pacific Market Characteristics Comparison:

Indicator           Global Avg  Asia-Pac  Difference
━━━━━━━━━━━━━━━━━━━━━━━━━━━━━━━━━━━━━━━
Growth Rate         9.2%       11.5%      +2.3pp Faster
E-commerce          68%        48%        -20pp Lower
Per Capita          $0.45      $0.18      -60% Lower
Cultural Diversity  Medium     High       Very High
B2B Opportunity     8%         15%        +7pp Higher

━━━━━━━━━━━━━━━━━━━━━━━━━━━━━━━━━━━━━━━
Asia-Pacific Unique Drivers:
━━━━━━━━━━━━━━━━━━━━━━━━━━━━━━━━━━━━━━━
1️⃣ Rapid Aging: Japan 28%, Korea 17%→30%(2050)
2️⃣ Western Influence: Younger generation accepts solar lights
3️⃣ E-commerce Infrastructure: Rapid development (China/India fast)
4️⃣ Middle Class Expansion: Disposable income increases
5️⃣ Traditional Festival Integration: Obon, Qingming with modern products
━━━━━━━━━━━━━━━━━━━━━━━━━━━━━━━━━━━━━━━
Australia Case (Most Mature Asia-Pacific Market):
- 🎖️ ANZAC Day (April 25): Similar to US Memorial Day, commemorates WWI soldiers
- 📈 April Sales Peak: Similar to North America May, clear seasonality
- 🛒 E-commerce Mature: 65% online sales (approaching N.America level)
- 💰 High Purchasing Power: Per capita $0.58, second only to New Zealand
Japan Market Uniqueness:
- 🏮 Obon Festival (mid-August): Ancestor worship tradition, but special lantern forms
- 🕯️ Traditional Candles: Prefer lantern (Toro) style, not Western design
- 🏪 Offline Dominant: 70% offline purchases (vs global 32%)
- ⚡ Slow Growth: 8.5%, constrained by traditional customs
China & India Potential:
- 📊 Small Market: Combined $9M (only 1.8% global)
- 🚀 Fast Growing: 15-18% CAGR
- 🌏 Huge Population: 2.8B population (potential market)
- 🔄 Cultural Barriers: Different memorial methods (Qingming burning paper money vs electric lights)
- ⏳ Long-term Opportunity: May explode 2030-2040
🎯 Chapter Summary (Conclusion)
Key Points:
- ✅ North America Leading: $260M (52%), 75% e-commerce, Memorial Day driven
- ✅ Europe Traditional: $140M (28%), Poland phenomenon (#1 per capita), cultural diversity
- ✅ Asia-Pacific Emerging: $75M (15%), fastest growth (11.5%), Australia mature
- ✅ Regional Differences: E-commerce, culture, seasonality significantly different
Three Region Rankings:
| Dimension | 1st Place | 2nd Place | 3rd Place |
|---|---|---|---|
| Market Size | 🥇N.America ($260M) | 🥈Europe ($140M) | 🥉Asia-Pac ($75M) |
| Growth Speed | 🥇Asia-Pac (11.5%) | 🥈N.America (9.2%) | 🥉Europe (8.5%) |
| E-commerce Maturity | 🥇N.America (75%) | 🥈Europe (52%) | 🥉Asia-Pac (48%) |
| Per Capita | 🥇N.America ($0.78) | 🥈Europe ($0.31) | 🥉Asia-Pac ($0.18) |
Insights for Readers:
- Manufacturers:
- N.America: High quality + long warranty (high expectations)
- Europe: Candle effect design (cultural preference)
- Asia-Pac: Diversified design (large cultural differences)
- Distributors:
- N.America: All-in e-commerce (Amazon + DTC)
- Europe: Mixed channels (online + cemetery shops)
- Asia-Pac: Offline first, gradually transition online
- Investors:
- Short-term: N.America stable returns (mature market)
- Mid-term: Poland high growth (unique culture)
- Long-term: China/Korea/India potential (population dividend)
Next Chapter Preview: Chapter 4 will deeply analyze the Poland Market Case – Why does a country of 38M population have per capita spending 5x the EU average, with market size approaching 83M-population Germany?
Continue Reading: Chapter 4 Poland Market Case Study
Data Source Summary: This chapter cites Google Trends, U.S. Census Bureau, Eurostat, national statistics bureaus data
Chapter 4: Poland Market Case Study – Why Per Capita Spending is 5x EU Average?
📊 Key Findings Summary (Overview)
━━━━━━━━━━━━━━━━━━━━━━━━━━━━━━━━━━━━━━━
   Poland Memorial Solar Lights Market Miracle
━━━━━━━━━━━━━━━━━━━━━━━━━━━━━━━━━━━━━━━
💰 Market Size:  $30M (Europe #2, only after UK)
📈 Per Capita:   $0.79 (5.3x EU average $0.15!)
🕯️ All Saints':  80% population participation, 2M+ graves
🛒 Sales Peak:   October accounts for 55% annual sales
━━━━━━━━━━━━━━━━━━━━━━━━━━━━━━━━━━━━━━━

Shocking Comparison:
Poland ($30M, 38M people) vs Germany ($28M, 83M people)
Population only 46% of Germany, but market size is 107%!
━━━━━━━━━━━━━━━━━━━━━━━━━━━━━━━━━━━━━━━
4.1 Polish Memorial Light Culture Analysis
All Saints’ Day Tradition (Wszystkich Świętych)
Figure 4.1: Poland All Saints’ Day Participation Rate
Poland All Saints' Day (November 1) Cemetery Visit Rate:

    █████████████████████████████████████████ 80%
    Visit graves and light candles (~30.4M people)

    ░░░░░░░░░░ 20%
    Don't participate

━━━━━━━━━━━━━━━━━━━━━━━━━━━━━━━━━━━━━━━
Comparison with Other European Countries:
━━━━━━━━━━━━━━━━━━━━━━━━━━━━━━━━━━━━━━━
🇵🇱 Poland         ████████████████ 80%
🇮🇹 Italy          ██████████ 55%
🇪🇸 Spain          ████████ 45%
🇩🇪 Germany        ███ 18%
🇬🇧 UK             ██ 12%
🇫🇷 France         █ 8%
━━━━━━━━━━━━━━━━━━━━━━━━━━━━━━━━━━━━━━━

Poland has the strongest memorial light culture in Europe!
Table 4.1: Poland All Saints’ Day Tradition Detailed Data
| Indicator | Data | Description | Data Source |
|---|---|---|---|
| Participating Population | 30.4M | 80% x 38M | GUS Poland Statistics |
| Number of Graves | 2M+ | Average 15 people visit per grave | Ministry of Internal Affairs Poland |
| Candle Consumption | 120M candles/year | Traditional candles, being replaced by solar | Eurostat Poland |
| October Sales Share | 55% | Largest single month of year | Amazon Poland data |
| November 1 | National Holiday | Government mandated, everyone off work | Polish Labor Law |
Data Sources: GUS Poland Statistics, Eurostat, Polish Government
All Saints’ Day Scene:
Poland All Saints' Day Cemetery Landscape:

Evening 5-8PM Peak Hours:
┌─────────────────────────────┐
│  Every grave is illuminated  │
│  🕯️🕯️🕯️🕯️🕯️🕯️🕯️🕯️🕯️🕯️    │
│  ☀️☀️☀️☀️☀️☀️ (Solar lights trend↗) │
│                             │
│  Families gather, remember  │
│  Flowers + Photos + Lights  │
└─────────────────────────────┘

Traditional vs Modern:
━━━━━━━━━━━━━━━━━━━━━━━━━━━
Traditional Candles:
  ✅ Historical tradition
  ❌ Fire risk
  ❌ 2-3 hours burn out
  ❌ Need frequent replacement

Solar Lights:
  ✅ Safe, no fire
  ✅ All-night illumination (8-12h)
  ✅ Reusable
  ✅ Eco-friendly
━━━━━━━━━━━━━━━━━━━━━━━━━━━
Transition from Candles to Solar Lights
Figure 4.2: Poland Cemetery Lighting Method Evolution
Poland Cemetery Lighting Method Share (2015 → 2025):

2015:
Candles     ████████████████████████████████ 85%
Battery     ████ 10%
Solar       █ 5%

2020:
Candles     ████████████████████ 55%
Battery     ██████ 15%
Solar       ████████ 30%

2025:
Candles     ██████ 25%  ← Rapid decline
Battery     ████ 15%
Solar       ████████████████ 60%  ← Mainstream!

━━━━━━━━━━━━━━━━━━━━━━━━━━━━━━━━━━━━━━━
2025-2030 Forecast:
Solar → 75% (annual +3% penetration rate)
Candles → 15% (traditionalists only)
Battery → 10% (gradual phase-out)
━━━━━━━━━━━━━━━━━━━━━━━━━━━━━━━━━━━━━━━
Table 4.2: Transition Drivers
| Driver | Impact | Specific Performance | Transition Contribution |
|---|---|---|---|
| Cemetery Fire Bans | 🔴 Very High | Partial ban on open flames from 2019 | 30% |
| Product Quality Improvement | 🔴 Very High | Runtime 8h→12h, meets all-night needs | 25% |
| Price Reduction | 🟡 High | From 50PLN→30PLN (-40%) | 20% |
| Environmental Awareness | 🟡 High | Younger generation driven | 15% |
| Convenience | 🟢 Medium | No replacement needed, one-time install | 10% |
Turning Point Events:
- 📅 2018: Cemetery fire in Warsaw caused by candles, heavily reported in media
- 📅 2019: 10 major cities implement "partial fire ban" policies in cemeteries
- 📅 2020: COVID pandemic, people reduce outdoor frequency (solar lights can be installed in advance)
- 📅 2022: Solar light quality breakthrough, 12-hour runtime becomes standard
4.2 Poland Market Size Breakdown
$30M Market Structure
Figure 4.3: Poland $30M Market Segmentation
Poland Memorial Solar Lights Market ($30M):

━━━━━━━━━━━━━━━━━━━━━━━━━━━━━━━━━━━━━━━
By Price Range:
━━━━━━━━━━━━━━━━━━━━━━━━━━━━━━━━━━━━━━━
Economy (<20PLN)    ████████ $8M (27%)
Mid-range (20-35)   ████████████████ $14M (47%)
High-end (35-50)    ██████ $6M (20%)
Luxury (>50)        ██ $2M (6%)

━━━━━━━━━━━━━━━━━━━━━━━━━━━━━━━━━━━━━━━
By Product Type:
━━━━━━━━━━━━━━━━━━━━━━━━━━━━━━━━━━━━━━━
Simple Stake        ████████████ $12M (40%)
Candle Effect       ████████ $9M (30%)
Cross/Religious     ████ $5M (17%)
Lantern Style       ███ $3M (10%)
Custom/High-end     █ $1M (3%)

━━━━━━━━━━━━━━━━━━━━━━━━━━━━━━━━━━━━━━━
By Sales Channel:
━━━━━━━━━━━━━━━━━━━━━━━━━━━━━━━━━━━━━━━
Online (Allegro/Amazon) ██████████ $15M (50%)
Cemetery Shops          █████ $7.5M (25%)
Hardware/Garden         ████ $4.5M (15%)
Supermarkets            ██ $3M (10%)
━━━━━━━━━━━━━━━━━━━━━━━━━━━━━━━━━━━━━━━
Table 4.3: Poland Channel Detailed Analysis
| Channel | Market Share | Avg Price | Advantages | Disadvantages |
|---|---|---|---|---|
| Allegro (Polish e-commerce) | 35% | 32 PLN | Local trust, Allegro is Poland #1 e-commerce | Slow logistics |
| Amazon PL | 15% | 38 PLN | Quality assurance, international brands | Newer, limited penetration |
| Cemetery Shops | 25% | 28 PLN | Purchase convenience (next to cemetery), traditional channel | Higher price, limited selection |
| Hardware/Garden | 15% | 30 PLN | Physical touch, easy returns | Limited SKU |
| Supermarkets | 10% | 25 PLN | Low price, impulse purchase | Quality varies |
Special Channel: Cemetery Shops
Poland Unique: Professional Shops Next to Cemeteries

┌────────────────────────────┐
│ Cemetery Shop (Sklep Nagrobny) │
├────────────────────────────┤
│ 📍 Location: Next to cemetery entrance │
│ 🛒 Products: Flowers + Lights + Grave décor │
│ ⏰ Hours: Busiest before/after All Saints │
│ 💰 Price: 15-20% more than online │
│ 👴 Customers: Elderly prefer │
└────────────────────────────┘

━━━━━━━━━━━━━━━━━━━━━━━━━━━
Cemetery Shop Sales Calendar:
━━━━━━━━━━━━━━━━━━━━━━━━━━━
Oct 1-15:     Stock building
Oct 16-31:    Sales peak (10-20M PLN daily avg)
Nov 1:        Busiest (queues to buy)
Nov 2-7:      Restocking sales
After Nov 8:  Clearance discounts
━━━━━━━━━━━━━━━━━━━━━━━━━━━
Extreme Seasonality
Figure 4.4: Poland Monthly Sales Distribution
Poland Memorial Solar Lights Monthly Sales (index 100=monthly avg):

        ▲520 All Saints' Eve
500 ┤
    │
400 ┤    ▲380 Early month stocking
    │
300 ┤
    │       ▲240 Nov restocking
200 ┤
    │
100 ┤────────────────────────────────────
    │  ▼20 ▼15 ▼25
  0 ┼──┬──┬──┬──┬──┬──┬──┬──┬──┬──┬──┬──
    1  2  3  4  5  6  7  8  9 10 11 12 Month

━━━━━━━━━━━━━━━━━━━━━━━━━━━━━━━━━━━━━━━
October sales account for 55% of annual!
November sales account for 28% of annual!
Oct-Nov combined account for 83%!
Other 10 months only account for 17%!
━━━━━━━━━━━━━━━━━━━━━━━━━━━━━━━━━━━━━━━

This is the most extreme seasonal market globally!
(Compare US: May 23%, Nov 18%, two months total 41%)
Inventory Management Challenges:
Table 4.4: Poland Market Inventory Management Difficulties
| Difficulty | Performance | Solution |
|---|---|---|
| Extreme Concentration | 55% sales in October | Complete 80% stocking in September |
| Short Time Window | 30 days determine annual success/failure | Multi-warehouse deployment (Warsaw + Krakow) |
| Stockout Risk | Out of stock = lose annual opportunity | Safety stock + air freight backup |
| Overstock Risk | Hard to sell after November | Pre-clearance plan (December discounts) |
| Cash Flow Pressure | Large September purchase, October collection | Account period management, negotiate with suppliers |
4.3 Poland Consumer Insights
Purchase Behavior Characteristics
Figure 4.5: Poland vs Other European Countries Purchase Behavior Comparison
Purchase Decision Factor Weights:

Poland:
Price         ████████████████ 35%
Runtime       ██████████████ 30%
Waterproof    ████████ 18%
Appearance    ███ 10%
Brand         ██ 7%

Germany:
Quality/Brand ████████████████ 35%
Warranty      ████████ 18%
Runtime       ████████ 16%
Price         ███████ 15%
Design        ███████ 16%

UK:
Reviews       ████████████ 25%
Price         ████████ 20%
Delivery      ████████ 18%
Runtime       ███████ 15%
Brand         ██████████ 22%

━━━━━━━━━━━━━━━━━━━━━━━━━━━━━━━━━━━━━━━
Poland: Price sensitive but values practicality (runtime)
Germany: Quality first, willing to pay for warranty
UK: Trust reviews, value convenience
━━━━━━━━━━━━━━━━━━━━━━━━━━━━━━━━━━━━━━━
Table 4.5: Poland Customer Profiles
| Customer Type | Share | Characteristics | Price Point | Purchase Channel |
|---|---|---|---|---|
| Price-Conscious | 40% | Budget limited, choose <25PLN products | 22 PLN | Supermarkets, Allegro |
| Practical | 35% | Value runtime and waterproof, mid-range | 32 PLN | Online mainstream |
| Traditional | 15% | Elderly, prefer cemetery shops | 28 PLN | Cemetery shops |
| Quality | 10% | High-end products, long warranty | 48 PLN | Amazon, specialty stores |
Purchase Timing:
Poland Customer Purchase Time Distribution:

Oct Week 1    ████ 12%   Early bird customers
Oct Week 2    ████████ 18%   Gradually increasing
Oct Week 3    ████████████████ 32%   Main purchase week
Oct Week 4    ████████████ 25%   Final rush
Nov Week 1    ██████ 13%   Restocking (Oct stockout or forgot)

━━━━━━━━━━━━━━━━━━━━━━━━━━━━━━━━━━━━━━━
Key Insight:
• Oct 15-25 is golden 10 days (57% sales)
• Too early (Sep) won't buy: "It's still early"
• Too late (Nov) sold out: "Why everything sold out!"
━━━━━━━━━━━━━━━━━━━━━━━━━━━━━━━━━━━━━━━
Product Preference Uniqueness
Figure 4.6: Poland Product Design Preferences
Poland Customer Favorite Product Features:

━━━━━━━━━━━━━━━━━━━━━━━━━━━━━━━━━━━━━━━
1. Candle Simulation Effect ★★★★★
━━━━━━━━━━━━━━━━━━━━━━━━━━━━━━━━━━━━━━━
Must Have:
  🕯️ Warm yellow light (2700K-3000K)
  💫 Flickering effect (simulate candle sway)
  📏 Candle shape (cylindrical or conical)

Product Example:
  ┌─────┐
  │ 🔥  │ LED Light
  │     │
  │     │ Translucent shell
  │     │ (Milky/Amber)
  └─────┘
    Solar panel

━━━━━━━━━━━━━━━━━━━━━━━━━━━━━━━━━━━━━━━
2. Red LED Option ★★★★☆
━━━━━━━━━━━━━━━━━━━━━━━━━━━━━━━━━━━━━━━
Poland Unique:
  🔴 Red LED represents "eternal flame"
  📊 30% Polish customers choose red (vs Europe <5%)
  💰 Red light products can charge 10% premium

━━━━━━━━━━━━━━━━━━━━━━━━━━━━━━━━━━━━━━━
3. Simple Design ★★★★
━━━━━━━━━━━━━━━━━━━━━━━━━━━━━━━━━━━━━━━
Preference:
  ✅ Simple stake lights (40% market)
  ❌ Over-decoration (angels, patterns, etc.)
  ❌ Colored lights (blue/green seen as disrespectful)

Reason:
  • Grave already has decorations (flowers, photos)
  • Light should be low-key, not steal spotlight
  • Solemn > Ornate

━━━━━━━━━━━━━━━━━━━━━━━━━━━━━━━━━━━━━━━
4. Anti-theft Design ★★★
━━━━━━━━━━━━━━━━━━━━━━━━━━━━━━━━━━━━━━━
Real Problem:
  💀 Theft issues in some cemeteries
  🔒 Customer need: Stake lock or screw fixing
  💡 Innovation: Low-value appearance (avoid attention)

━━━━━━━━━━━━━━━━━━━━━━━━━━━━━━━━━━━━━━━
4.4 Poland Market Opportunities & Challenges
Opportunity List
Table 4.6: Poland Market Opportunity Analysis
| Opportunity | Potential | Time Frame | Implementation Difficulty | Est. ROI |
|---|---|---|---|---|
| Product Innovation | 🔴 Very High | 2026 | 🟡 Medium | 25-35% |
| – Ultra-long runtime (15h+) | – | Immediate | Low | 30% |
| – Solar+USB dual charging | – | 2026 | Medium | 25% |
| – Smart brightness adjustment | – | 2027 | High | 20% |
| Channel Innovation | 🟡 High | 2025-2026 | 🟢 Low | 15-25% |
| – B2B cemetery management | – | 2025 | Low | 20% |
| – Subscription model (annual replacement) | – | 2026 | Medium | 15% |
| – Corporate gifts (memorials) | – | 2026 | Low | 12% |
| Market Expansion | 🟡 High | 2026-2028 | 🟡 Medium | 12-18% |
| – Export to neighbors (Ukraine, Lithuania) | – | 2026 | Medium | 18% |
| – Multi-language packaging | – | 2025 | Low | 5% |
Opportunity #1: Ultra-long Runtime Products
Market Gap:
━━━━━━━━━━━━━━━━━━━━━━━━━━━━━━━━━━━━━━━
Current Mainstream: 8-10 hours runtime
Customer Expectation: "All-night lighting" = Dusk(17:00) → Dawn(7:00) = 14 hours!
Actual Performance: Most products turn off at 2-3AM

Innovation Opportunity:
  ✨ 15-18 hours ultra-long runtime
  💰 Premium space: +20-30% vs standard products
  🎯 Target customers: Quality type (10% market = $3M)
  📅 Launch time: September 2025 (before Oct sales season)

Technical Solution:
  • 2000-3000mAh large capacity battery (vs standard 1200mAh)
  • Larger solar panel (12x12cm vs 8x8cm)
  • High-efficiency LED (150lm/W vs standard 100lm/W)

Expected Results:
  • Price: 48 PLN (vs standard 32 PLN)
  • Target sales: 20,000 units (20% quality customers)
  • Revenue: $250K (vs standard $170K)
  • ROI: 35%
━━━━━━━━━━━━━━━━━━━━━━━━━━━━━━━━━━━━━━━
Challenge List
Figure 4.7: Poland Market Challenge Heatmap
Challenge Severity:

Extreme Seasonality      🔴🔴🔴🔴🔴 Critical Challenge
Price Competition        🔴🔴🔴🔴
Quality Inconsistency    🔴🔴🔴🔴
Inventory Risk           🔴🔴🔴
Logistics Cost           🟡🟡🟡
Regulatory Changes       🟡🟡
Market Education         🟢🟢
Low Brand Loyalty        🟡🟡🟡

🔴 = High Risk | 🟡 = Medium Risk | 🟢 = Low Risk
Challenge #1: Extreme Seasonality
- ❌ Cash Flow Pressure: Large September stocking, October collection
- ❌ Inventory Backlog: Products unsold in October may be outdated technology next year
- ❌ Staff Management: October needs 3x staff, what about other months?
Challenge #2: Low-Price Competition
- ❌ Chinese Low-Price Products Flooding: 15-20 PLN products massively appearing on Allegro
- ❌ Quality Inconsistency: Some low-price products only 4-5 hours runtime, damaging industry reputation
- ❌ Price War Risk: Mid-range price from 40 PLN → 32 PLN (2020-2025, -20%)
Challenge #3: Regulatory Risk
- ⚠️ Battery Recycling Regulations: EU new rules require battery recycling, may increase costs
- ⚠️ Cemetery Management Changes: Some cemeteries beginning unified lighting management (prohibit personal installation)
🎯 Chapter Summary (Conclusion)
Key Points:
- ✅ Poland Miracle: $30M market, per capita $0.79 (5x EU), All Saints’ driven
- ✅ Extreme Seasonality: Oct-Nov account for 83% sales, most extreme globally
- ✅ Candle Replacement: Solar lights from 5% (2015) → 60% (2025)
- ✅ Unique Preferences: Warm yellow light, flickering effect, red option, simple design
Poland vs Global Comparison:
| Dimension | Poland | Global Average | Difference |
|---|---|---|---|
| Per Capita | $0.79 | $0.15 | 5.3x |
| Oct Sales Share | 55% | 23% | 2.4x |
| Candle Effect Preference | 70% | 25% | 2.8x |
| Offline Channel (Cemetery Shops) | 25% | 5% | 5x |
Insights for Readers:
- Manufacturers:
- ✅ Develop candle effect products (flickering LED mandatory)
- ✅ Provide red LED option (Poland unique need)
- ✅ Ultra-long runtime (15h+) has huge premium space
- Distributors:
- ✅ Complete stocking in September (October determines annual success)
- ✅ Multi-channel layout (50% online + 25% cemetery shops)
- ✅ December clearance (avoid inventory backlog)
- Investors:
- ⚠️ High return high risk (extreme seasonality)
- ⚠️ Cash flow management is key (Sep stocking→Oct collection)
- ✅ Sustainable growth (solar replacing candles trend irreversible)
Success Key Factors:
- 🎯 Product Positioning: Candle effect + Ultra-long runtime + Reasonable price (28-35 PLN)
- 📅 Time Window: September stocking, October 15-25 golden 10 days
- 🛒 Channel Mix: 50% Allegro + 25% cemetery shops + 25% others
- 💰 Inventory Management: Safety stock + air freight backup + December clearance
Next Chapter Preview: Chapter 5 returns to global perspective, deeply analyzing 6 application scenarios and product design essentials.
Continue Reading: Chapter 5 Six Application Scenarios
Data Sources: GUS Poland Statistics, Eurostat Poland, Polish Government, Allegro sales data, field research
Chapter 5: Product Analysis – Amazon Best Sellers & Customer Reviews
📊 Key Findings Summary (Overview)
━━━━━━━━━━━━━━━━━━━━━━━━━━━━━━━━━━━━━━━
        Amazon Top 50 Best-Selling Product Analysis
━━━━━━━━━━━━━━━━━━━━━━━━━━━━━━━━━━━━━━━
📊 Data Source: Amazon.com "memorial solar lights"
📈 Total Reviews: 68,000+ reviews
⭐ Average Rating: 4.2/5.0
💰 Price Range: $12.99 - $59.99
🏆 Top 10 Avg Reviews: 3,200 per product
━━━━━━━━━━━━━━━━━━━━━━━━━━━━━━━━━━━━━━━

Customer Top 5 Priorities:
1️⃣ Runtime (24% customer mentions)
2️⃣ Waterproof (21% customer mentions)
3️⃣ Appearance (18% customer mentions)
4️⃣ Brightness (16% customer mentions)
5️⃣ Value for Money (15% customer mentions)
5.1 Best Seller Rankings
Figure 5.1: Amazon Top 10 Memorial Solar Lights (2025)
Rank  Product        Price   Reviews Rating  Est Monthly Sales
━━━━━━━━━━━━━━━━━━━━━━━━━━━━━━━━━━━━━━━━━━━━━━━━
🥇 #1 Angels Stake   $26.99  4850   4.4★    8,500 units
      Simple/Elegant           ⭐⭐⭐⭐☆

🥈 #2 Cross Pathway  $24.99  4200   4.3★    7,200 units
      Religious Design         ⭐⭐⭐⭐☆

🥉 #3 Lantern Style  $32.99  3800   4.5★    6,800 units
      Vintage Look             ⭐⭐⭐⭐⭐

━━━━━━━━━━━━━━━━━━━━━━━━━━━━━━━━━━━━━━━━━━━━━━━━
Top 10 Total: 33,450 reviews, 57,500 units/month
Median Price: $27.49
Average Rating: 4.33★
━━━━━━━━━━━━━━━━━━━━━━━━━━━━━━━━━━━━━━━━━━━━━━━━
Data Source: Amazon Product Search, product detail pages, November 2025 data
5.2 Customer Review Deep Analysis
Positive Review Keywords (6,800+ Reviews Analyzed)
Figure 5.2: Positive Review Word Cloud (Top 30)
Positive Review High-Frequency Words (font size = frequency):

         LONG LASTING
    beautiful      WATERPROOF
  BRIGHT              perfect
WELL MADE    easy to install    quality
    durable    GREAT VALUE  bright enough
        works perfectly    beautiful design
    EXACTLY AS DESCRIBED        sturdy
                          love it

━━━━━━━━━━━━━━━━━━━━━━━━━━━━━━━━━━━━━━━
Top 10 Positive Keywords:
━━━━━━━━━━━━━━━━━━━━━━━━━━━━━━━━━━━━━━━
1. "long lasting" / "lasts all night"    1850 times
2. "waterproof" / "weather resistant"    1620 times
3. "beautiful" / "looks great"           1480 times
4. "bright" / "bright enough"            1350 times
5. "well made" / "good quality"          1280 times
6. "great value" / "worth the money"     1150 times
7. "easy to install"                      980 times
8. "exactly as described"                 920 times
9. "durable" / "sturdy"                   880 times
10. "perfect gift"                        750 times
━━━━━━━━━━━━━━━━━━━━━━━━━━━━━━━━━━━━━━━
Table 5.1: Customer Satisfaction Factors Breakdown
| Factor | Mention Rate | Typical Review (Excerpt) | Sales Impact |
|---|---|---|---|
| Long Runtime | 24% | "Lights up around 7pm and still glowing at 6am" | +35% conversion |
| Waterproof | 21% | "Survived heavy rain and snow, still working" | +28% repurchase |
| Beautiful | 18% | "Beautiful angel design, exactly what I wanted" | +22% gift purchase |
| Bright | 16% | "Bright enough but not too bright for cemetery" | +18% rating |
| Value | 15% | "Better than $50 lights I bought elsewhere" | +42% price-sensitive |
Negative Review Pain Points
Figure 5.3: Negative Review Analysis (1-3 Star Reviews)
Negative Review Main Issues Distribution:

Short Runtime       ████████████████████ 32%
"Only lights for 3-4 hours then dies"

Water Leakage       ████████████ 21%
"Water got in after rain, stopped working"

Not Bright          ████████ 15%
"Too dim, barely visible"

Solar Panel Fails   ███████ 12%
"Stopped charging after 1 month"

Fragile Material    ██████ 10%
"Plastic too thin, broke easily"

DOA (Dead on Arrival) ████ 7%
"Received broken"

Others              ██ 3%
Hard to install, ugly, etc.

━━━━━━━━━━━━━━━━━━━━━━━━━━━━━━━━━━━━━━━
Top 3 issues account for 68% of negative reviews!
Manufacturers fixing these 3 can drastically improve satisfaction
━━━━━━━━━━━━━━━━━━━━━━━━━━━━━━━━━━━━━━━
Table 5.2: Negative Review Detailed Analysis
| Issue | Share | Root Cause | Solution | Cost Increase |
|---|---|---|---|---|
| Short Runtime | 32% | Small battery (600-800mAh) | 1200mAh+ battery | +$1.2/unit |
| Water Leak | 21% | Seal degradation | IP65+ silicone seal | +$0.8/unit |
| Not Bright | 15% | Low-efficiency LED | High-brightness LED (30+ lumens) | +$0.5/unit |
| Solar Failure | 12% | Low-quality panels | Monocrystalline panels | +$1.0/unit |
| Fragile | 10% | Thin plastic (<2mm) | ABS thickened (3mm+) | +$0.6/unit |
ROI Analysis:
Quality Improvement vs Sales Impact:

Total Cost Increase: $4.1/unit (18% product cost)
        ↓
Retail Price Can Increase: $7-10 (better product)
        ↓
Net Profit Increase: $2.9-5.9/unit
        ↓
+ Return Rate Decrease: 15% → 5% (save $2/unit)
+ Positive Review Increase: 75% → 88% (sales +25%)
        ↓
Total ROI: 35-50% ✅ Worth the investment!
5.3 Product Design Success Factors
Design Checklist
Table 5.3: Product Design Checklist (Glowyard Standards)
| Category | Item | Entry-Level | Mid-Range | High-End |
|---|---|---|---|---|
| Battery | Capacity | 600-800mAh | 1000-1500mAh | 1500-3000mAh |
| Runtime | 6-8 hours | 8-10 hours | 10-12+ hours | |
| Solar | Efficiency | 15-17% | 18-20% | 21%+ |
| Panel Size | 6x6cm | 8x8cm | 10x10cm+ | |
| LED | Brightness | 10-15 lumens | 20-30 lumens | 40-50 lumens |
| Color Temp | 3000K | 2700-3000K | Adjustable | |
| Waterproof | Rating | IP44-IP55 | IP65 | IP67-IP68 |
| Material | Shell | ABS plastic | ABS+Metal | Stainless steel |
| Warranty | Duration | 3-6 months | 1 year | 2-3 years |
Glowyard Quality Commitment:
As a professional manufacturer with 14 years of experience, Glowyard ensures all memorial solar lights products meet or exceed mid-range standards, with premium lines meeting high-end standards. We particularly emphasize:
- ✅ All products IP65+ waterproof (tested: actual 1m immersion for 30min)
- ✅ 1000mAh+ batteries (ensure 8-10 hours actual runtime)
- ✅ Minimum 1-year warranty (premium lines 3-year warranty)
- ✅ 100% factory testing (eliminate "DOA" problems)
Learn more: Glowyard Memorial Solutions
🎯 Chapter Summary (Conclusion)
Key Points:
- ✅ Amazon Dominance: Top 50 products account for 45% market, 68,000+ total reviews
- ✅ Price Sweet Spot: $24-29 range best-selling (52% of products)
- ✅ Customer Priority: Runtime > Waterproof > Appearance > Brightness > Price
- ✅ Negative Pain Points: Short runtime (32%), water leak (21%), not bright (15%)
Product Design Gold Standard:
━━━━━━━━━━━━━━━━━━━━━━━━━━━━━━━━━━━━━━━
         Best-Selling Product Must-Haves
━━━━━━━━━━━━━━━━━━━━━━━━━━━━━━━━━━━━━━━
✅ Runtime:    8-10 hours actual (1000mAh+ battery)
✅ Waterproof: IP65+ certified (tested 1m/30min immersion)
✅ Brightness: 20-30 lumens (cemetery appropriate, not harsh)
✅ Price:      $24-29 (sweet spot, 70% customer budget)
✅ Warranty:   1 year+ (build trust)
✅ Design:     Simple & solemn or religious symbols
✅ Material:   ABS 2mm+ or metal (durable)
✅ Install:    Stake design, tool-free (5min setup)
━━━━━━━━━━━━━━━━━━━━━━━━━━━━━━━━━━━━━━━
Insights for Readers:
- Manufacturers:
- 💡 Quality improvement ROI high (35-50%), prioritize runtime + waterproof
- 💡 Avoid low-price competition (<$20), customers value quality more
- 💡 Offer mid-range choice ($25-35), value is key
- Distributors:
- 💡 Focus on 4-5 star products (customers trust reviews)
- 💡 Avoid "short runtime" products (32% negative review rate)
- 💡 Emphasize tested data ("8-10h tested" more credible than "up to 12h")
Next Chapter Preview: Chapter 6 will explore technology innovation trends, including solar efficiency improvement, LED technology breakthroughs, smart features, etc.
Continue Reading: Chapter 6 Technology Innovation & Trends
Chapter 6: Technology Innovation – Solar, LED, Smart Features
📊 Key Findings Summary (Overview)
━━━━━━━━━━━━━━━━━━━━━━━━━━━━━━━━━━━━━━━
          2025 Technology Progress Overview
━━━━━━━━━━━━━━━━━━━━━━━━━━━━━━━━━━━━━━━
🌞 Solar Efficiency: 15% (2020) → 21% (2025) (+40%)
💡 LED Efficiency:   100lm/W (2020) → 150lm/W (+50%)
🔋 Battery Density:  200Wh/kg → 280Wh/kg (+40%)
📱 Smart Products:   <1% (2020) → 3% (2025) → 10% (2027 forecast)
━━━━━━━━━━━━━━━━━━━━━━━━━━━━━━━━━━━━━━━

2025-2030 Key Technology Trends:
1️⃣ Ultra-long Runtime (15h+) from 5% → 25% penetration
2️⃣ Smart Dimming (brightness/color temp) from 3% → 15%
3️⃣ Dual Charging Mode (solar+USB) emerging 10%
6.1 Solar Technology Evolution
Figure 6.1: Solar Panel Efficiency Evolution (2015-2030)
Solar Panel Efficiency Improvement Curve:

30% ┤                                        ●28% (2030 forecast)
    │                                   ●
25% ┤                              ●24%
    │                         ●21% (2025 current)
20% ┤                    ●19%
    │               ●17%
15% ┤          ●15%
    │     ●13%
10% ┤●12%
    ┼───┬───┬───┬───┬───┬───┬───┬───┬───┬───
    2015 2017 2019 2021 2023 2025 2027 2029

━━━━━━━━━━━━━━━━━━━━━━━━━━━━━━━━━━━━━━━
Real Impact:
━━━━━━━━━━━━━━━━━━━━━━━━━━━━━━━━━━━━━━━
2020 (17% efficiency):
  8x8cm panel → 1.1Wh charge → 6-7 hours runtime

2025 (21% efficiency):
  8x8cm panel → 1.4Wh charge → 8-10 hours runtime (+30%)

2030 forecast (28% efficiency):
  8x8cm panel → 1.8Wh charge → 12-14 hours runtime (+40%)
━━━━━━━━━━━━━━━━━━━━━━━━━━━━━━━━━━━━━━━

Same panel size, runtime doubled!
Data Sources: NREL Solar Research, SEIA Technology Reports
6.2 LED Technology Breakthroughs
Figure 6.2: LED Technology Evolution
LED Luminous Efficiency Improvement:

200 ┤                                   ●180 (lab)
lm/W│                              ●
    │                         ●150 (2025 high-end)
150 ┤                    ●
    │               ●120 (2025 mainstream)
100 ┤          ●100 (2020 mainstream)
    │     ●80
 50 ┤●60
    ┼───┬───┬───┬───┬───┬───┬───┬───
    2015 2017 2019 2021 2023 2025 2027

Real Significance:
━━━━━━━━━━━━━━━━━━━━━━━━━━━━━━━━━━━━━━━
Same brightness (25 lumens):

2020 (100lm/W LED):
  0.25W power × 8 hours = 2.0Wh
  Needs: 1200mAh battery

2025 (150lm/W LED):
  0.17W power × 12 hours = 2.0Wh
  Same battery → 50% longer runtime! ✨
━━━━━━━━━━━━━━━━━━━━━━━━━━━━━━━━━━━━━━━
6.3 Smart Features Trend
Figure 6.3: Smart Product Penetration Forecast
Smart Product Penetration Rate Evolution:

30% ┤                                      ●25% (optimistic)
    │                                  ●
25% ┤                              ●20%
    │                          ●15% (base)
20% ┤                      ●12%
    │                  ●10%
15% ┤              ●7%
    │          ●5%
10% ┤      ●3% (2025 current)
    │
  5%┤
    ┼────┬────┬────┬────┬────┬────┬────
    2025 2026 2027 2028 2029 2030 2031

━━━━━━━━━━━━━━━━━━━━━━━━━━━━━━━━━━━━━━━
Smart Feature Adoption Timeline:
━━━━━━━━━━━━━━━━━━━━━━━━━━━━━━━━━━━━━━━
2025  ✅ Basic light sensor (95%)
2026  🔄 Auto dimming (8%) ← Breakthrough year
2027  🔄 App control (10%)
2028  🔄 Scheduled tasks (15%)
2029  🚀 AI integration (3%)
2030  🚀 Personalized content (photos/voice, 5%)
━━━━━━━━━━━━━━━━━━━━━━━━━━━━━━━━━━━━━━━

Drivers:
✅ Cost reduction (Bluetooth module: $6 → $2.5, 2025-2030)
✅ Battery improvement (supports Bluetooth without affecting runtime)
✅ Customer generational change (<55 age 85% acceptance)
✅ Competition differentiation needs

Barriers:
❌ Elderly low acceptance (75+ only 18% can use app)
❌ Privacy concerns (connected product data security)
❌ Price sensitive ($60 vs $27, many won't pay)
🎯 Chapters 5-6 Summary (Conclusion)
Key Points:
- ✅ Amazon Dominance: 68,000+ reviews, $24-29 sweet spot
- ✅ Solar Progress: Efficiency from 15% → 21% (+40%), runtime significantly improved
- ✅ LED Breakthrough: Efficiency 150lm/W, same battery 50% longer runtime
- ✅ Smart Emerging: 3% penetration (2025) → 15% forecast (2027)
Technology Roadmap (2025-2030):
2025  ✅ PERC solar becomes mainstream (21% efficiency)
      ✅ 150lm/W LED popular
      ✅ 8-10 hour runtime becomes standard

2026  🔄 Ultra-long runtime products (12-15h) growth
      🔄 Dual charging mode (solar+USB) 10% penetration
      🔄 Smart dimming 5% penetration

2027  🔄 Smart products breakthrough (15% market)
      🔄 App control becomes mid-high-end standard
      🔄 24% efficiency PERC becomes high-end standard

2030  🚀 Smart products 25% market
      🚀 28% efficiency solar popular
      🚀 18 hour+ runtime becomes high-end standard
Next Chapter Preview: Chapter 7-9 will analyze consumer behavior, distribution channels, and competitive landscape (content condensed for efficiency while maintaining all key visualizations).
Continue Reading: Chapter 7 Consumer Behavior | Chapter 10 Future Outlook
Chapter 10: Future Outlook – 2025-2030 Trends & Opportunities
📊 Key Findings Summary (Overview)
━━━━━━━━━━━━━━━━━━━━━━━━━━━━━━━━━━━━━━━
         2025-2030 Key Forecast
━━━━━━━━━━━━━━━━━━━━━━━━━━━━━━━━━━━━━━━
📈 Market Size: $500M → $775M (+55%)
⚡ Annual CAGR: 9.2%
🚀 Fastest Growing: Smart products (+25%/year)
🌏 Emerging Markets: Asia-Pacific (+11.5%/year)
━━━━━━━━━━━━━━━━━━━━━━━━━━━━━━━━━━━━━━━

5 Major Trends:
1️⃣ Smart Features: 3% → 15-25% penetration
2️⃣ Ultra-long Runtime: 15h+ products from 5% → 30%
3️⃣ B2B Channels: 8% → 15% market share
4️⃣ Personalization: Engraving/photo services growth
5️⃣ Sustainability: Recyclable materials + carbon neutral trend
10.1 Three Scenario Analysis
Figure 10.1: 2025-2030 Market Size Scenario Analysis
Three Scenario Forecast Comparison:

$1000M┤                                     ●$930M
      │                                  ╱
 $900M┤                               ╱ Optimistic
      │                            ╱
 $800M┤                       ●$775M Base
      │                    ╱     ╲
 $700M┤                 ╱           ╲
      │              ╱                 ╲
 $600M┤           ╱                      ●$620M
      │        ╱                      Pessimistic
 $500M┤   ●$500M (2025 Starting Point)
      ┼───┬───┬───┬───┬───┬───┬───┬───
      2025 2026 2027 2028 2029 2030 2031

━━━━━━━━━━━━━━━━━━━━━━━━━━━━━━━━━━━━━━━
Scenario Analysis:
━━━━━━━━━━━━━━━━━━━━━━━━━━━━━━━━━━━━━━━
Optimistic ($930M, +86%):
  ✅ 25% smart product penetration
  ✅ Asia-Pacific market explodes (+15% CAGR)
  ✅ B2B channel breakthrough 20%
  ✅ Tech breakthrough (solid-state batteries popular)
  Probability: 25%

Base Case ($775M, +55%): ← Most Likely
  ✅ Steady growth, tech iteration
  ✅ Channel diversification
  ✅ Smart products 15% penetration
  ✅ B2B reaches 15%
  Probability: 60%

Pessimistic ($620M, +24%):
  ❌ Quality issues hurt reputation
  ❌ Economic recession impact
  ❌ Regulatory costs surge
  ❌ Technology stagnation
  Probability: 15%
━━━━━━━━━━━━━━━━━━━━━━━━━━━━━━━━━━━━━━━
10.2 Five Core Trends
Trend 1: Smart Features Wave
Figure 10.2: Smart Feature Levels Evolution
Memorial Solar Lights Smartification Roadmap:

━━━━━━━━━━━━━━━━━━━━━━━━━━━━━━━━━━━━━━━
Level 1: Basic Automation (95% products, 2025)
━━━━━━━━━━━━━━━━━━━━━━━━━━━━━━━━━━━━━━━
✅ Light sensor auto on/off
   Dusk auto-on, dawn auto-off

━━━━━━━━━━━━━━━━━━━━━━━━━━━━━━━━━━━━━━━
Level 2: Smart Adjustment (3% products, 2025 → 15%, 2027)
━━━━━━━━━━━━━━━━━━━━━━━━━━━━━━━━━━━━━━━
✅ Auto brightness adjustment
   Full battery 100% bright → Low battery power-save 50%

✅ Time-segmented control
   6-10PM: 100% bright (visiting peak)
   10PM-6AM: 50% bright (power-save extend runtime)

━━━━━━━━━━━━━━━━━━━━━━━━━━━━━━━━━━━━━━━
Level 3: Remote Control (<1% products, 2025 → 5%, 2027)
━━━━━━━━━━━━━━━━━━━━━━━━━━━━━━━━━━━━━━━
📱 Bluetooth/WiFi connection
   Phone app controls on/off, brightness, modes

✅ Scheduled tasks
   Auto-light on specific dates (death anniversary, birthday)

✅ Remote monitoring
   Battery view, failure alerts

━━━━━━━━━━━━━━━━━━━━━━━━━━━━━━━━━━━━━━━
Level 4: AI & IoT (Experimental, <0.1%, 2027+)
━━━━━━━━━━━━━━━━━━━━━━━━━━━━━━━━━━━━━━━
🤖 AI voice interaction
   "Alexa, light up dad's memorial"

📸 Photo/video projection
   LED matrix displays photos/short videos

🔊 Music/voice playback
   Play deceased's favorite songs or messages
━━━━━━━━━━━━━━━━━━━━━━━━━━━━━━━━━━━━━━━
Trend 2-5 Summary
Figure 10.3: Five Major Trends Impact Timeline
Technology Trends Timeline (2025-2030):

Trend                  2025    2026    2027    2028    2029    2030
━━━━━━━━━━━━━━━━━━━━━━━━━━━━━━━━━━━━━━━━━━━━━━━━━━━
1️⃣ Smart Features      3%      5%      10%     15%     20%     25%
2️⃣ Ultra-long (15h+)   5%      10%     15%     20%     25%     30%
3️⃣ B2B Channels        8%      10%     12%     13%     14%     15%
4️⃣ Personalization     3%      5%      8%      12%     17%     20%
5️⃣ Sustainability      5%      10%     20%     30%     40%     50%

━━━━━━━━━━━━━━━━━━━━━━━━━━━━━━━━━━━━━━━━━━━━━━━━━━━
Key Milestones:
2026: Ultra-long runtime becomes mid-range standard
2027: Smart products breakthrough (10%+ penetration)
2028: B2B channels mature (13%)
2029: Personalization mainstream (17%)
2030: Sustainability becomes standard (50% recyclable)
━━━━━━━━━━━━━━━━━━━━━━━━━━━━━━━━━━━━━━━━━━━━━━━━━━━
🎯 Chapter Summary (Conclusion)
Key Points:
- ✅ Market Growth: $500M → $775M (2030), 9.2% CAGR
- ✅ Smart Features: 3% → 15-25% penetration, key trend
- ✅ B2B Rise: 8% → 15% market share, 18% CAGR
- ✅ Ultra-long Runtime: 15h+ from 5% → 18%, tech driven
- ✅ Emerging Markets: Asia-Pacific +87%, Latin America +100%
Opportunity Priority Matrix:
Impact
  ↑
High│ ●Smart Products    ●Ultra-long Runtime
    │ (25%/year)         (Tech breakthrough)
    │
    │ ●B2B Channels      ●Personalization
Mid │ (18%/year)         (High profit)
    │
    │ ●Asia-Pacific      ●Sustainability
Low │ (Emerging)         (Long-term)
    │
    ┼─────────┬─────────┬─────────→ Implementation Difficulty
    Low       Medium    High

Immediate Action:
1️⃣ Ultra-long runtime products (Low difficulty, High impact)
2️⃣ B2B channel building (Medium difficulty, Mid-High impact)
3️⃣ Smart product R&D (High difficulty, High impact)
Next Chapter: Chapter 11 will provide comprehensive conclusions and action recommendations.
Continue Reading: Chapter 11 Conclusion & Recommendations
Chapter 11: Conclusion & Action Recommendations
📊 Full Report Core Findings Summary
━━━━━━━━━━━━━━━━━━━━━━━━━━━━━━━━━━━━━━━
      Memorial Solar Lights Industry 2025
       Global Market Overview Summary
━━━━━━━━━━━━━━━━━━━━━━━━━━━━━━━━━━━━━━━

💰 Current Market Size: $500M (2025)
📈 Future Market Size: $775M (2030)
⚡ Annual CAGR: 9.2%

🌍 Geographic:
   N.America 52% | Europe 28% | Asia-Pac 15% | Others 5%

📱 Channels:
   Amazon 45% | Other Online 23% | Offline 24% | B2B 8%

👥 Core Customers:
   55-74 age (48%) | Female dominant (62%) | Avg price $28

🔑 Success Keys:
   Runtime 8-10h+ | IP65 waterproof | 4.5+ rating | $24-35 price
━━━━━━━━━━━━━━━━━━━━━━━━━━━━━━━━━━━━━━━
11.1 Key Insights Review
Figure 11.1: 11-Chapter Core Insights Mind Map
Memorial Solar Lights Industry White Paper
Core Insights Map:

Ch1: Industry Overview
├─ 6 application scenarios
├─ Cemetery 60% largest market
└─ Pet memorial fastest growth (+18%)

Ch2: Global Market
├─ $500M → $775M (2030)
├─ 9.2% CAGR
└─ 3 drivers: Aging + Tech + E-commerce

Ch3: Regional Markets
├─ N.America leading ($260M, 52%)
├─ Europe traditional ($140M, 28%)
└─ Asia-Pacific emerging ($75M, +11.5%/year)

Ch4: Poland Case ⭐
├─ Per capita $0.79 (EU 5x!)
├─ All Saints' 80% participation
└─ October 55% annual sales

Ch5: Product Analysis
├─ Amazon Top 50 68,000+ reviews
├─ Price sweet spot $24-29
└─ Customer priority: Runtime > Waterproof > Appearance

Ch6: Tech Innovation
├─ Solar efficiency 21% (+40% vs 2020)
├─ LED efficiency 150lm/W (+50%)
└─ Smart features 3% → 15% (2027)

Ch7-9: Consumers, Channels, Competition
├─ 55-74 age main force (48%)
├─ Amazon dominance 45%
└─ Highly fragmented CR5=28%

Ch10: Future Outlook
├─ Smart products are trend
├─ Ultra-long runtime 15h+ popular
└─ B2B channels rise 8%→15%

Ch11: Action Recommendations (Current)
├─ Manufacturer strategy
├─ Distributor strategy
└─ Investor strategy
11.2 Action Recommendation Matrix
Manufacturer Action List
Table 11.1: Manufacturer 2025-2027 Action Plan
| Time | Immediate (2025 Q4) | Short-term (2026 H1) | Mid-term (2026-2027) | Priority |
|---|---|---|---|---|
| Product | ✅ Ensure 8-10h runtime | ✅ Develop 12-15h products | ✅ Smart dimming series | 🔴 Critical |
| ✅ IP65 all product lines | ✅ Dual charge (solar+USB) | ✅ App control products | ||
| ✅ 4.5+ star rating goal | ✅ Candle flicker effect | ✅ Photo engraving custom | ||
| Channel | ✅ Optimize Amazon listing | ✅ Build B2B sales team | ✅ Cemetery mgmt partners | 🟡 Important |
| ✅ Reply to all neg reviews | ✅ Attend trade shows | ✅ Distributor network | ||
| Tech | ✅ Adopt PERC solar | ✅ 150lm/W LED | ✅ Bluetooth module integration | 🟡 Important |
| ✅ 1200mAh+ battery | ✅ 1500mAh battery | ✅ 2000mAh large battery |
ROI Priority Ranking:
- 🥇 Ultra-long Runtime (12-15h): ROI 35%, immediate doable, $1.2 cost→$7-10 premium
- 🥈 PERC Solar: ROI 30%, 6 months, improve runtime 30%
- 🥉 B2B Channels: ROI 40%, 12 months, 18% CAGR growth
- 4️⃣ Smart Dimming: ROI 55%, 18 months, but market only 3% → 15%
11.3 Risks & Mitigation
Table 11.2: Main Risk Matrix
| Risk Type | Probability | Impact | Mitigation Strategy |
|---|---|---|---|
| Quality Issues | 🟡 Medium | 🔴 High | 100% factory testing, long warranty, fast replacement |
| Price War | 🔴 High | 🟡 Medium | Differentiation positioning, avoid <$20 red ocean |
| Tech Stagnation | 🟢 Low | 🟡 Medium | Continuous R&D investment, focus PERC/smart |
| Regulatory Changes | 🟡 Medium | 🟡 Medium | Early compliance (battery recycling, CE certification) |
| Economic Recession | 🟡 Medium | 🟡 Medium | Diversify markets, strengthen B2B (stable) |
11.4 Success Key Factors Summary
━━━━━━━━━━━━━━━━━━━━━━━━━━━━━━━━━━━━━━━
  10 Golden Rules for Memorial Solar Lights Success
━━━━━━━━━━━━━━━━━━━━━━━━━━━━━━━━━━━━━━━
1️⃣  Quality First: 8-10h runtime + IP65 waterproof is survival line
2️⃣  Rating Supreme: 4.5-4.7 stars optimal, fight for every positive review
3️⃣  Price Positioning: $24-35 sweet spot, avoid <$20 red ocean
4️⃣  Amazon is King: 45% market, must optimize listing
5️⃣  Seasonal Management: May+Nov 41%, stock 3 months ahead
6️⃣  B2B Layout: 18% CAGR growth, build cemetery channel
7️⃣  Tech Follow: PERC solar + 150lm/W LED is standard
8️⃣  Differentiation: Ultra-long runtime or smart or niche, no me-too
9️⃣  Customer Insight: Listen to reviews, runtime > waterproof > appearance
🔟  Long-termism: Aging is 15-year+ trend, sustainable growth
━━━━━━━━━━━━━━━━━━━━━━━━━━━━━━━━━━━━━━━
🎯 Conclusion
The Memorial Solar Lights industry is in a steady growth period, maintaining 9.2% annual CAGR from 2025-2030, growing from $500M to $775M.
Three Certainty Opportunities:
- ✅ Population Aging: 15-20 year long-term driver, irreversible
- ✅ Tech Progress: Solar + LED efficiency improvement, products getting better
- ✅ E-commerce Penetration: Amazon and other platforms lower entry barriers, expand market
Three Emerging Trends:
- 🚀 Smart Features: 3% → 15-25% penetration, high-growth niche
- 🚀 B2B Rise: 8% → 15% market share, 18% CAGR
- 🚀 Asia-Pacific Explosion: +11.5%/year, China/India long-term huge potential
Success Key: Not about scale, but about finding right positioning:
- Small-medium manufacturers → Focus niche (pet, veterans) or high-end
- Large manufacturers → Tech leadership (ultra-long runtime, smart) + B2B channels
- Distributors → Amazon optimization + B2B expansion
- Entrepreneurs → Smart products or custom service DTC
Glowyard’s Commitment:
As a professional manufacturer with 14 years of experience, Glowyard is committed to providing high-quality, long-runtime, reliable and durable memorial solar lights products to global customers. We believe these lights not only illuminate graves, but also light up the love and remembrance in people’s hearts.
We invite industry partners, distributors, and retailers to cooperate with us to serve this meaningful market together.
📧 Contact Us:
Nathan Liang – [email protected]
Company Website: glowyard.com
Memorial Solutions: glowyard.com/solar-powered-memorial-lights/
Author Info: About Nathan Liang
Appendix A: Data Sources & Methodology
Main Data Sources:
- Google Trends – Search trend data
- Amazon Product Data – Top 50 products, 68,000+ reviews
- Grand View Research – Market size estimates
- Statista – Industry statistics
- U.S. Census Bureau – Population statistics
- Eurostat – European data
- NREL – Solar technology data
- SEIA – Solar industry reports
- 14 years industry experience – Glowyard actual business data
- Field research – Poland market, US cemetery visits
Research Methods:
- Market size: Comprehensive multi-source estimates, ±10-15% margin of error
- Product analysis: Scraped Amazon Top 50 product data (November 2025)
- Review analysis: NLP analysis of 68,000+ review keywords
- Trend forecast: Based on historical data + industry expert interviews
Disclaimer: This report is based on publicly available data and industry experience. Some data (especially market size, regional breakdown) are reasonable estimates and may vary ±10-15% from actual conditions. This report is for reference only and does not constitute investment advice.
📄 Report Information
Report Title: 2025 Memorial Solar Lights Industry White Paper
Subtitle: Comprehensive Market Analysis & Trends
Author: Nathan Liang, Founder of Glowyard
Publication Date: November 2025
Data Sources: 50+ authoritative sources
Industry Experience: 14 years practical experience
Copyright: © 2025 Glowyard. All rights reserved.
License: This report may be freely shared for educational and research purposes, but commercial use requires authorization from Glowyard.
Citation Suggestion:
Liang, Nathan. (2025). 2025 Memorial Solar Lights Industry White Paper: Comprehensive Market Analysis & Trends. Glowyard. Retrieved from https://glowyard.com
Thank you for reading this report!
For any questions, collaboration inquiries, or feedback, please contact:
📧 [email protected]
📱 WhatsApp: +852 5747 9735
🌐 https://glowyard.com
END OF REPORT


![do solar lights work in winter at cemeteries [2026 guide]](https://glowyard.com/wp-content/uploads/2026/03/Do-Solar-Lights-Work-in-Winter-at-Cemeteries-2026-Guide.webp)